Thursday, July 31,2025 - 14:39 GMT+7  Việt Nam EngLish 

Vietnam seafood market – July 2025 

 Wednesday, July 30,2025
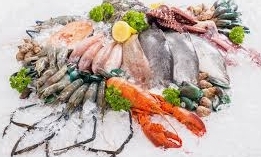
AsemconnectVietnam - Shrimp prices in July 2025 varied depending on type, size, and region. In general, large-size whiteleg shrimp (30 count/kg) ranged from VND145,000 to VND175,000 per kg, while giant black tiger shrimp (10–15 count/kg) were priced around VND185,000–195,000 per kg. In the Mekong Delta (ĐBSCL), raw whiteleg shrimp prices for sizes 30–80 count/kg rose by VND1,000–4,000 per kg, while prices for sizes 90 count/kg and above remained mostly unchanged.

Pangasius (tra fish) prices in July 2025 showed clear signs of recovery in the Mekong Delta, bringing profits of VND6,000–7,000 per kg. In Đồng Tháp, raw pangasius fetched VND31,500–31,800 per kg, while production costs were around VND26,500 per kg. Responding to the positive signals, many farmers in Đồng Tháp and An Giang began rehabilitating ponds and reinvesting in production. However, experts advised caution to avoid mass expansion that could lead to oversupply and price fluctuations. Investment decisions should be made carefully to ensure a balance between profitability and long-term industry stability.
 
Imports
According to preliminary data from the General Department of Customs, Vietnam’s seafood imports in June 2025 slightly declined by 2.7% compared to May, reaching nearly USD273.55 million. Cumulatively, imports in the first half of 2025 totaled over USD1.58 billion, up 29.72% year-on-year.
In the first five months of 2025, Indonesia was Vietnam’s largest seafood supplier. However, by the end of June, India had overtaken Indonesia to become the top source, accounting for 14.91% of total seafood import value with over USD235.77 million, a sharp 86.21% increase from the same period in 2024.
Indonesia ranked second, with imports reaching nearly USD234.63 million, representing 14.83% of the total, a strong 77.09% increase year-on-year. However, in June alone, import value from Indonesia slightly decreased by 14.67% from the previous month, to nearly USD33.13 million.
Norway remained the third-largest seafood supplier to Vietnam, accounting for 11.08% of the total. Imports from Norway in June 2025 rose by 11.97% from May, to over USD32.44 million. For the first six months, the cumulative value reached over USD175.25 million, up 13.62% year-on-year.
Imports from China slightly decreased by 3.79% in June 2025 from the previous month to USD19.76 million, but the 6-month total still rose 8.85% year-on-year to over USD135.80 million.
Japan rounded out the list of Vietnam’s seafood import markets exceeding USD100 million, with a value of over USD122.62 million in the first half of 2025, up 27.38% from the same period in 2024, accounting for 7.75% of total imports.
Among Vietnam’s top 10 seafood import markets (with values in the tens of millions of USD) during the first six months of 2025, the following showed strong year-on-year growth:
·         Denmark (+145.31%) – nearly USD13.25 million
·         Chile (+60.89%) – nearly USD86.67 million
·         USA (+52.03%) – over USD40.41 million
·         UK (+48.76%) – nearly USD26.42 million
·         Philippines (+22.78%) – over USD23.58 million
·         Malaysia (+9.19%) – over USD10.38 million
Meanwhile, some markets saw year-on-year declines:
·         Canada (-14.76%) – nearly USD11.33 million
·         Taiwan (-8.55%) – over USD70.05 million
·         South Korea (-2.61%) – over USD43.40 million
Thailand topped the list of markets with seafood imports worth millions of USD. While its import value surged by 62.56% in June 2025 compared to May, reaching over USD1.75 million, the cumulative figure for the first half of 2025 still dropped sharply by 24.67%, totaling only over USD9.27 million.
Seafood import table for the first 6 months of 2025
(Calculated according to data published on July 10, 2025 by the Customs Department)
Unit: USD
Market
Value T6/2025
(USD)
Compared to T5/2025
(%)
Value 6M/2025
(USD)
Compared to
6M/2024 (%)
 
Value Proportion 6T/2025
(%)
Total Imports
273,549,124
-2.7
1,581,590,924
29.72
100
SOUTHEAST ASIA (*)
39,406,867
-16.83
280,230,382
58.96
17.72
India
45,868,785
17.76
235,774,802
86.21
14.91
Indonesia
33,129,999
-14.67
234,625,384
77.09
14.83
Norway
32,440,073
11.97
175,253,691
13.62
11.08
China
19,760,516
-3.79
135,802,681
8.85
8.59
Japan
25,032,978
8.06
122,622,568
27.38
7.75
Chile
11,078,847
-26.52
86,665,842
60.89
5.48
Taiwan (China)
15,378,361
18.39
70,051,866
-8.55
4.43
Russia
11,647,712
13.41
55,133,176
-4.72
3.49
Korea
8,983,855
59.22
43,400,230
-2.61
2.74
US
12,744,904
48.26
40,412,470
52.03
2.56
UK
4,384,545
-28.02
26,418,786
48.76
1.67
Philippines
1,984,876
-63.66
23,582,866
22.78
1.49
Denmark
2,149,612
-4.33
13,246,790
145.31
0.84
Canada
3,400,039
79.18
11,329,896
-14.76
0.72
Malaysia
1,795,751
2.31
10,380,074
9.19
0.66
Thailand
1,753,494
62.56
9,273,454
-24.67
0.59
Source: Customs Department
Vietnam Seafood Exports – June 2025
According to preliminary data from the General Department of Customs, Vietnam’s seafood exports in June 2025 reached nearly USD906.24 million, down 9.11% compared to May 2025. However, in the first half of 2025, total seafood exports brought in over USD5.11 billion, representing a 15.87% increase year-on-year. These figures reflect a strong recovery and renewed momentum for Vietnam’s seafood sector, following a challenging period marked by market disruptions and high input costs.
 
Key Export Markets
China, the United States, and Japan remained the top three importers of Vietnamese seafood in the first six months of 2025, collectively accounting for 52.5% of total export value:
·         China: Exports surged 47.3% year-on-year to exceed USD1 billion
·         United States: Up 14.76%, reaching over USD897.78 million
·         Japan: Increased 11.1% to over USD782.34 million
 
Export Performance by Trade Agreement Bloc
·         RCEP markets: Exports to countries under the Regional Comprehensive Economic Partnership (RCEP) rose 21.92%, totalling over USD2.66 billion, and accounted for 52.05% of Vietnam’s total seafood exports.
·         CPTPP markets: Exports to CPTPP members reached over USD1.39 billion, up 8.07% year-on-year, accounting for 27.21% of the total.
·         European Union (EU): Export value grew 8.23% to nearly USD523.73 million, making up 10.24% of total seafood exports.
·         Southeast Asia: Exports to ASEAN countries totaled over USD327.53 million, an increase of 21.26%, representing 6.41% of total exports.
 
Notable Emerging Market
Brazil recorded the strongest growth among Vietnam’s top 15 seafood export markets. Exports to Brazil in the first half of 2025 reached nearly USD94.23 million, up a remarkable 76.9% year-on-year, making it the most prominent growth market in this period.
Seafood export table for the first 6 months of 2025 (Calculated according to data published on July 10, 2025 by the Customs Department)
Markets
Value T6/2025
(USD)
Month on month
(%)
Value 6M/2025
(USD)
Year on year
(%)
Value Proportion 6M/2025
(%)
Total Exports
906,237,414
-9.11
5,113,099,716
15.87
100
FTA RCEP-15 markets (*)
488,992,055
2.59
2,661,569,716
21.92
52.05
FTA CPTPP-11 markets (*)
268,690,617
10.1
1,391,152,005
8.07
27.21
China (Mainland)
181,158,309
-1.02
1,004,276,027
47.3
19.64
US
131,724,149
-43.8
897,783,097
14.76
17.56
Japan
149,832,047
6.66
782,343,960
11.1
15.3
(EU) FTA EVFTA-27 markets (*)
93,486,855
-7.1
523,726,048
8.23
10.24
Korea
68,234,205
-2.56
384,725,173
5.96
7.52
SOUTHEAST ASIA (*)
59,540,409
2.35
327,530,628
21.26
6.41
Australia
28,487,916
20.78
152,930,340
-0.26
2.99
UK
32.91 3,505
15.67
15 2,921,675
7.03
2.99
Thailand
24,772,960
5.35
139,965,499
31.34
2.74
Canada
21,164,231
7.4
123,138,743
4.71
2.41
Germany
17,556,555
-5.31
100,551,857
6.68
1.97
Netherlands
15,825,923
-16.58
100,164,827
3.07
1.96
Brazil
16,088,581
-2.25
94,228,046
76.9
1.84
Russia
12,246,290
-24.95
92,348,850
-3.51
1.81
Taiwan (China)
17,197,818
-5.23
84,142,459
12.96
1.65
Belgium
17,618,568
-1.75
81,398,155
23.47
1.59
Hong Kong (China)
12,885,111
1.24
73,366,551
0.91
1.43
Malaysia
11,867,608
7.86
60,584,395
18.19
1.18
Italy
8,592,376
-22.87
54,404,797
10.56
1.06
Philippines
8,922,137
-14.21
52,701,273
16.58
1.03
 
                                                                                                                                                                                                                              Source: Customs Department
Vietnam seafood export product structure – First half of 2025
Shrimp and pangasius remain Vietnam’s two key seafood export products, both showing positive growth:
·         Shrimp: Export value reached USD2.07 billion, up 26% compared to the same period in 2024.
·         Pangasius (tra fish): Exported over USD1.023 billion, up 11% year-on-year.
 
Pangasius Market Developments
The U.S. market has shown signs of optimism for Vietnamese pangasius, particularly after the U.S. Department of Commerce (DOC) announced the final results of the POR20 review. Seven Vietnamese companies were granted 0% anti-dumping duties, which could boost exports significantly if countervailing duties remain low.
Despite its overall strength, the pangasius industry remains heavily reliant on low-value, minimally processed products, especially frozen fillets (HS0304). As global trends shift towards higher-value, processed, ready-to-eat seafood, Vietnam faces increasing pressure to upgrade and restructure its value chain. Countries such as the U.S., EU, Canada, Japan, and Mexico are demanding fully processed seafood products—clean, cooked, portioned, and often accompanied by sauces or packaging suitable for retail or foodservice.
Vietnam currently leads the supply of processed pangasius to the U.S. and EU, surpassing competitors like India and Indonesia due to superior processing capabilities.
 
Pangasius Export Structure (Jan–Jun 2025)
·         Total export value: USD1.023 billion, up 11%
·         HS03 group (frozen whole, cut, dried fish): USD997 million, 98% share
o    HS0304 (frozen fillets): USD821 million, up 11%
·         HS16 group (processed products): USD26 million, up 48%, showing strong growth potential
 
Key Markets:
·         China & Hong Kong: Still the largest buyer despite a 4% YoY drop to USD249 million
·         U.S.: Strong recovery; June exports hit USD34 million (+23%), H1 exports totaled USD175 million (+10%)
·         Brazil: Rapid growth; June exports USD16 million (+111%), H1 exports USD175 million
·         EU: Modest growth; June exports down 15% to USD13 million, but H1 reached USD90 million (+5%)
o    Netherlands: Largest importer in EU with USD26 million, up 11%
 
Shrimp Export Highlights
·         Total H1 exports: USD2.07 billion, up 26% YoY
·         U.S. market: Valued at USD341 million, up 13%
o    Vietnam stands out for its value-added, convenient shrimp products, commanding the highest average price among suppliers.
 
U.S. Shrimp Supply Ranking (by volume, H1 2025):
1.     India: 133,000 tons (+21%)
2.     Ecuador: 95,000 tons (+11%)
3.     Indonesia
4.     Vietnam: Over 21,000 tons (+4%)
 
U.S. Wholesale Market Conditions (July 2025)
·         Market remains quiet, especially for whiteleg and black tiger shrimp.
·         Buyers are closely monitoring trade negotiations, tariff changes, and supply by type, size, and origin.
·         Tariff competition is reshaping market dynamics and segmenting suppliers.
 
Temporary Countervailing Duty Rates (as of July 2, 2025):
·         Ecuador: 10%
·         Thailand: 36%
·         Indonesia: 32%
·         India: 26%
·         Vietnam: 20% (also subject to anti-dumping and countervailing duties)
Vietnam’s focus on value-added shrimp gives it a competitive edge despite facing substantial duties.
T.Huong
Source: Vitic

  PRINT     BACK


 © Vietnam Industry and Trade Information Center ( VITIC)- Ministry of Industry and Trade 
License: No 115/GP-TTĐT dated June 05, 2024 by the Ministry of Information and Communications.
Address: Room 605, 6 th Floor, The Ministry of Industry and Trade's Building, No. 655 Pham Van Dong Street, Nghia Do Ward, Hanoi city.
Tel. : (04)38251312; (04)39341911- Fax: (04)38251312
Websites: http://asemconnectvietnam.gov.vn 
Email: Asemconnectvietnam@gmail.com 
 

Hitcounter: 25727429860