


Imports of phones and components: slight downward trend
Monday, October 12,2026
AsemconnectVietnam - In August of 2026, the import value of phones and components reached US$1.04 billion, up by 7.51% from the previous month but down by 6.10% year-on-year.
For the first eight months of 2026, total import value stood at US$6.86 billion, a decrease of 1.66% compared to the same period of 2025.
This modest decline indicates relatively stable import activity and may reflect a trend of businesses increasing their use of domestic supplies or optimizing import volumes, specifically regarding components and equipment, to align with production needs. Compared to the robust growth in exports of phones and components, the slower pace of import growth has contributed to improving the trade balance for this product category.
China remained the primary source of phones and components for Vietnam, accounting for over 80% of total import value during the first eight months of 2026. Meanwhile, the imports from South Korea saw significant growth, whereas supplies from other sources, such as India, dropped sharply. Overall, the import structure remained heavily concentrated on a single major market, even as total demand for phone and component imports shows a slight downward trend.
In the first eight months of 2026, the imports from China totaled US$5.57 billion, down by 8.25% year-on-year. Although the market share fell from 86.89% to 81.09%, it still accounted for more than four-fifths of the country's total import value. In August alone, the imports from China reached $813.40 million, up by 9.16% from July but down by 12.91% year-on-year. Thus, China remained a pivotal source for Vietnam's imported phones and components; notably, the decline in imports from this market was the primary factor dragging down the total import value over the eight-month period.
South Korea ranked second, though its import volume was significantly lower than China's. In the eight months, import value reached $298.15 million, an increase of 11.12%, raising its share to 4.34% from 3.84% in the same period of the previous year. However, in August alone, imports from South Korea fell by 27.73% month-on-month and 20.05% year-on-year. The fact that the eight-month total rose despite a sharp drop in August indicates significant month-to-month volatility in imports from South Korea.
Taiwan demonstrated notable growth. The imports in the eight-month period totaled $30.16 million, up by 58.96%, increasing its market share from 0.27% to 0.44%. August imports alone reached $5.75 million, a 57.5% year-on-year increase. However, given the relatively small scale of imports from this market, the growth has not yet significantly impacted the total import value.
Meanwhile, the imports from Japan totaled $3.38 million over the eight months, up by 34.6%, while August imports reached $0.55 million, remaining virtually unchanged from the same period last year. Despite solid growth, Japan’s share stands at only about 0.05%, indicating its limited role in the total supply.
Notably, Hong Kong recorded a massive surge of 1,099.1%; however, as the value reached only $4.66 million, this increase stemmed primarily from a low base and has not yet significantly impacted total imports. Similarly, imports from the United States rose by 99.99% but amounted to just $0.42 million.
Conversely, India saw the sharpest decline among major suppliers; its eight-month import value fell by 72.26% to $2.86 million, causing its share to drop from 0.15% to 0.04%. The imports from the UK also fell by 81.16%, though the volume remained very small.
On a monthly basis, August import trends showed a 9.16% increase from China compared to July, whereas imports from South Korea, Taiwan, and Japan fell by 27.73%, 9.54%, and 9.51%, respectively. Thus, the 7.51% rise in total import value for August was driven primarily by the recovery of imports from China.
Overall, the structure of Vietnam's market for imported phones and components is shifting, yet market concentration remains high. The share of imports from China fell by 5.8 percentage points, from 86.89% to 81.09% while the shares of South Korea and Taiwan rose by 0.50 and 0.17 percentage points, respectively. This indicates that while supply sources are gradually diversifying into other markets, China retained a dominant position. Another notable point is that the FDI sector accounted for 91.30% of the total import value over the eight-month period, a slight decrease from the 92.83% recorded in the same period of 2025. This indicates that the imports of phones and components primarily serve foreign-invested enterprises, aligning with the nature of phone and electronics manufacturing in Vietnam.
In summary, during the first eight months of 2026, Vietnam's market for imported phones and components saw a slight decline in scale while maintaining a heavy reliance on supplies from China. South Korea remained the second-largest supplier, showing solid growth, while Taiwan and Japan also recorded significant increases, albeit from a smaller base. Looking ahead, import trends will continue to be driven primarily by the production demands of major electronics firms in Vietnam and supply developments from China.
Source: VITIC
Agricultural, forestry and fishery export: Growth driven by fruits, vegetables and seafood
Import-export turnover surged over 30% year-on-year in 9 months
Regulations on criteria and conditions for establishing Free Trade Zones issued
Vietnam's black pepper imports surged in 9 months of 2026
Vietnam's chemical exports showed solid growth in September
Industrial production increased 12.3% in 9 months, highest since 2019
Seafood exports exceed US$9 billion in 9 months of 2026
Domestic market accelerates, cementing role as economic anchor
VASEP proposes tax relief to support Vietnamese seafood exporters
Trade surplus rebounds in September after nine months of deficit
Fertilizer export markets remain heavily concentrated in Asia
Import-export and trade balance of FDI sector versus domestic enterprises
Vietnam’s seafood exports hit $9.1 billion in 9M
Chemical imports exceed $12.7 billion due to high demand
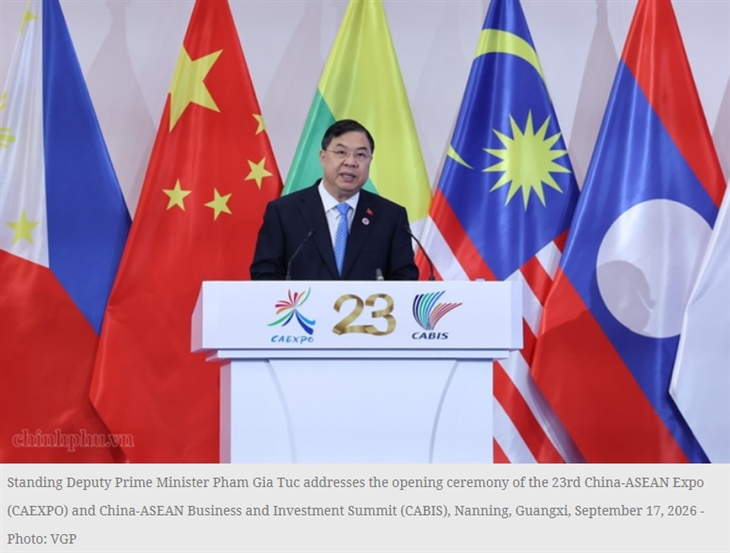
Viet Nam seeks to expand space for ASEAN-China cooperation ...
Viet Nam expects to make greater contributions to expanding the space for ASEAN-China cooperation for shared prosperity, underlined ...Top leader To Lam to attend 81st UNGA General Debate, ...
Viet Nam treasures friendly relations with Thailand: Prime ...
Viet Nam approves action program to implement ASEAN ...
The Vietnamese Government has approved an action program to implement the ASEAN Connectivity Strategic Plan in Viet Nam for 2026–2035 ...Industry and trade sector steps up strategic technology ...
Gov't approves National AI Strategy
Viet Nam continues to strengthen its strategic position in ...
