

Domestic Seafood Market – March 2026
Wednesday, April 8,2026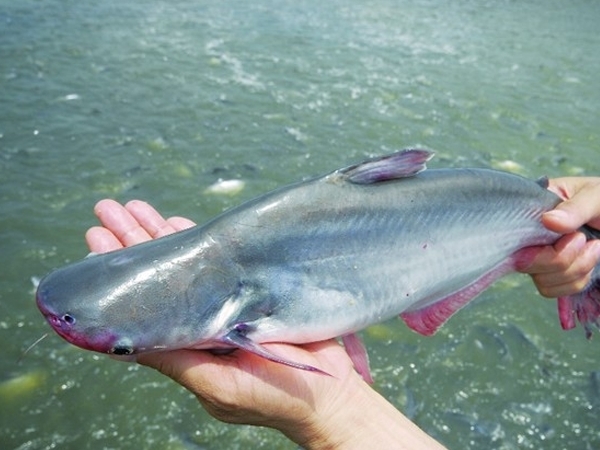
AsemconnectVietnam - According to National Statistic Office, the producer price index (PPI) for captured and aquaculture fishery products in the first quarter of 2026 increased by 2.69% compared to the previous quarter and rose by 4.28% year-on-year. Within this, the PPI for captured fishery products increased by 3.16% quarter-on-quarter and 5.29% year-on-year, while the PPI for aquaculture products rose by 2.47% and 3.79%, respectively.
According to AgroMonitor, pangasius fish prices continued to remain at record highs, although there were signs of a slowdown in mid-month. Prices for market-sized fish (0.8 - 1kg/fish) ranged from 33,000 – 35,000 VND/kg, an increase of 5,000 - 7,000 VND/kg compared to the end of 2025. Larger fish (over 1.3kg/fish) saw an additional increase of approximately 1,000 VND/kg during the week of March 5th - 11th.
Shrimp prices in the Mekong Delta region (Soc Trang, Bac Lieu, Ca Mau) recorded a slight decrease at the end of the month. Whiteleg shrimp (30-40 shrimp/kg) were priced at 170,000-200,000 VND/kg. Whiteleg shrimp (90-120 shrimp/kg) decreased by 1,000-3,000 VND/kg at the end of March 2026 due to reduced demand from processing plants exporting to China. Fish fingerling prices tended to fall sharply at the end of March due to a more abundant supply.
Vietnam’s seafood sector showed strong recovery momentum in early 2026, supported by rising export performance despite short-term fluctuations in monthly trade flows.
Vietnam’s seafood sector showed strong recovery momentum in early 2026, supported by rising export performance despite short-term fluctuations in monthly trade flows.
Cumulatively, in the first two months of 2026, Vietnam’s total seafood trade turnover reached USD2.18 billion. Of this, exports accounted for USD1.72 billion, marking a year-on-year increase of 20.2% compared to the same period in 2025. This was considered a positive signal, indicating that the industry remained on track toward achieving its full-year export target of USD11.5 billion in 2026.
Shrimp continued to be the leading export commodity, contributing nearly USD690 million, while pangasius recorded an impressive recovery with export value exceeding USD330 million. In the Mekong Delta, farm-gate pangasius prices reached a multi-year high of around 34,000 VND/kg, reflecting improved demand and tighter supply conditions.
Imports
According to calculations based on data from Vietnam Customs, seafood import turnover in February 2026 reached USD168.66 million, representing a sharp decline of 43.38% compared to January 2026.
However, cumulative imports in the first two months of 2026 totaled USD466.82 million, down 5.05% year-on-year. In February 2026, Indonesia, Norway, China (Mainland), and India were the four largest seafood suppliers to Vietnam.
Imports from India led in value, reaching USD74.9 million, down 3.79% year-on-year and accounting for 16.04% of total seafood imports. Indonesia ranked second with USD58.0 million, decreasing by 27.75% and accounting for 12.43%.
In contrast, imports from Norway and China (Mainland) increased, reaching USD55.26 million (+6.94%) and USD52.30 million (+8.21%), accounting for 11.84% and 11.20% of total imports, respectively.
Although imports declined sharply in February compared to January, cumulative imports for the first two months still showed notable growth from several markets, including Japan (up 37.49% to USD45.04 million), the United Kingdom (up 130.52% to USD12.45 million), Canada (up 38.6% to USD6.1 million), and Thailand (up 125.1% to USD4.42 million).
Vietnam Seafood Imports – February 2026
(Unit: USD)
|
Market
|
Feb 2026
Value |
Month on month
(%) |
2M 2026
Value |
Year on year 2025
(%) |
Share
(%) |
|
Total
|
168,659,981
|
-43.38
|
466,819,487
|
-5.05
|
100
|
|
Southeast Asia
|
27,845,741
|
-41.14
|
75,151,175
|
-19.89
|
16.10
|
|
India
|
23,049,281
|
-55.55
|
74,900,130
|
-3.79
|
16.04
|
|
Indonesia
|
20,512,577
|
-45.29
|
58,005,759
|
-27.75
|
12.43
|
|
Norway
|
16,593,917
|
-57.07
|
55,256,390
|
+6.94
|
11.84
|
|
China (Mainland)
|
20,313,771
|
-36.49
|
52,296,865
|
+8.21
|
11.20
|
|
Japan
|
20,562,963
|
-15.99
|
45,038,332
|
+37.49
|
9.65
|
|
Chile
|
8,189,583
|
-39.11
|
21,640,419
|
-13.62
|
4.64
|
|
Russia
|
5,144,534
|
-41.57
|
14,044,093
|
+26.54
|
3.01
|
|
Taiwan (China)
|
5,049,767
|
-39.12
|
13,344,074
|
-41.65
|
2.86
|
|
United States
|
4,302,892
|
-50.45
|
13,137,421
|
+49.15
|
2.81
|
|
United Kingdom
|
2,430,402
|
-75.74
|
12,447,132
|
+130.52
|
2.67
|
|
South Korea
|
3,640,579
|
-48.81
|
10,752,974
|
-27.39
|
2.30
|
|
Philippines
|
3,763,097
|
+4.99
|
7,347,482
|
-3.64
|
1.57
|
|
Canada
|
1,137,044
|
-77.07
|
6,096,873
|
+38.60
|
1.31
|
|
EU (EVFTA)
|
1,155,243
|
-69.70
|
4,967,876
|
-14.12
|
1.06
|
|
Malaysia
|
2,340,620
|
+3.50
|
4,602,083
|
+42.11
|
0.99
|
|
Thailand
|
1,003,798
|
-70.62
|
4,420,865
|
+125.10
|
0.95
|
|
Denmark
|
547,816
|
-82.82
|
3,736,153
|
-4.22
|
0.80
|
Source: VITIC calculations based on Vietnam Customs data
Exports
Seafood export turnover in February 2026 reached USD706.7 million, down 30.09% compared to January 2026. However, cumulative exports for the first two months rose strongly by 20.2% year-on-year to USD1.72 billion.
China remained Vietnam’s largest export market, accounting for 28.53% of total seafood exports, with turnover reaching USD489.96 million, up 58.28% compared to the same period in 2025.
Japan, the United States, and South Korea followed as key markets with export values exceeding USD100 million. Specifically, exports to Japan reached USD233.14 million (+4.84%), the United States USD209.32 million (-3.01%), and South Korea USD114.42 million (+2.8%). These markets accounted for 13.57%, 12.19%, and 6.66% of total export value, respectively.
Exports to the EU reached USD62.87 million in February 2026, down 34.01% from January. However, cumulative exports to the bloc rose 16.97% year-on-year to USD158.13 million, accounting for 9.21% of total exports.
Similarly, exports to Southeast Asia increased 21.48% year-on-year to USD118.16 million over the two-month period, although February alone saw a sharp decline of 45.33% compared to January.
Vietnam Seafood Exports – February 2026
(Unit: USD)
|
Market
|
Feb 2026
Value |
Month on month
(%) |
2M 2026
Value |
Year on year
(%) |
Share
(%) |
|
Total
|
706,695,436
|
-30.09
|
1,717,469,932
|
+20.20
|
100
|
|
China (Mainland)
|
245,366,636
|
+0.31
|
489,957,092
|
+58.28
|
28.53
|
|
Japan
|
83,359,941
|
-44.35
|
233,142,621
|
+4.84
|
13.57
|
|
United States
|
80,905,650
|
-37.00
|
209,319,567
|
-3.01
|
12.19
|
|
EU (EVFTA)
|
62,866,345
|
-34.01
|
158,127,339
|
+16.97
|
9.21
|
|
Southeast Asia
|
41,665,620
|
-45.53
|
118,158,684
|
+21.48
|
6.88
|
|
South Korea
|
37,690,428
|
-50.88
|
114,416,194
|
+2.80
|
6.66
|
|
Thailand
|
20,025,072
|
-45.17
|
56,548,090
|
+26.84
|
3.29
|
|
Australia
|
19,624,595
|
-38.24
|
51,403,627
|
+9.43
|
2.99
|
|
United Kingdom
|
19,199,426
|
-22.96
|
44,120,967
|
+6.29
|
2.57
|
|
Brazil
|
14,634,277
|
-45.26
|
41,367,663
|
+55.76
|
2.41
|
|
Canada
|
15,702,492
|
-18.84
|
35,050,212
|
-4.29
|
2.04
|
|
Germany
|
13,778,428
|
-33.84
|
34,605,916
|
+17.52
|
2.01
|
Source: VITIC calculations based on Vietnam Customs data
Source: Vitic
Vietnam's agricultural, forestry, and fisheries exports in first quarter of 2026
Vietnam's trade deficit reached US$3.64 billion in first quarter of 2026
Domestic rice market in March 2026: price stable
Agricultural Commodities Update – April 7, 2026 (Morning Session)
Dong Thap intensifies action to tackle IUU fishing
Imports of several agricultural products reached billion USD in Q1
Industrial production increased by 9%, many key sectors achieved breakthroughs
Retail, service sectors show optimistic signals in Q1
Agricultural Market Report April 6th: Durian and Coffee Prices Drop Sharply Under Supply Pressure
Ministry proposes advance mechanism for fuel price stabilisation fund
Vietnamese online exporters rewrite the rules of the game
Vietnam’s exports in maintained growth in Q1
Vietnam’s manufacturing PMI fell in March
Agricultural market April 5th: Coffee prices reversed downward, export rice prices increased by $30/ton
