

Vietnam – China imports and exports reached nearly 117 million USD
Wednesday, February 19,2020
AsemconnectVietnam - The imports and exports between Vietnam and China reached 116.866 billion USD in 2019, of which Vietnam's exports to China reached 41.414 billion USD and imported to 75.452 billion USD.
According to data from the General Department of Customs, in 2019, the total import-export turnover of all types of goods between Vietnam and China reached 517.26 billion USD, up by 7.6 per cent compared to 2018. Of the figure, the country’s exports of goods to China reached 264.19 billion USD, up by 8.4 per cent and imports of goods from China reached 253.07 billion USD, up by 6.8 per cent. Thus, the trade surplus amounted to 11.12 billion USD, the highest ever, up by 62.9 per cent compared to the previous year.
Among more than 200 countries and territories having import and export activities with Vietnam, China continued to be the largest market and 2019 was the second consecutive year the turnover between the two countries reached over 100 billion USD. Specifically, in 2019, the total import-export turnover between Vietnam and China reached 116.866 billion USD, of which Vietnam's exports were 41.414 billion USD and imports were 75.452 billion USD. Compared to 2018, the import-export turnover between Vietnam and China increased by more than 10 billion USD (the figure in 2018 was 106,706 billion USD).
Thus, China alone accounted for 22.6 per cent of the country's total import-export turnover in 2019. Especially, the country’s imports of goods from China accounted for nearly 30 per cent of the country's total import turnover. However, the increase in turnover was mainly from a sharp increase in imports from China, while Vietnam's exports to this neighboring country increased insignificantly.
In 2019, Vietnam's import value from China increased by 10.014 billion USD, while the country’s exports to China only increased by nearly 150 million USD. Therefore, the trade balance of our country with China had a huge deficit of more than 34 billion USD.
In the history of foreign trade relations of Vietnam, China was the first trading partner with the trade exchange of over 100 billion USD. This milestone was set in 2018 as mentioned above. Specifically, in 2018, Vietnam's total export turnover to China reached 41,268 billion USD, an increase of 5,864 billion USD compared to 2017, with a growth rate of 16.6 per cent. Meanwhile, the import value from this neighboring country reached 65,438 billion USD, up by 6,846 billion USD, equivalent to an increase of nearly 11,7 per cent. Thus, the total trade turnover of the two countries reached 106,706 billion USD, an increase of 12.71 billion USD compared to 2017. In 2018, the Chinese market alone accounted for 22.23 per cent of total import-export turnover of the whole country.
Vietnam’s exports of goods to China in 2019 -source: VITIC – according to the figures of the General Department of Customs – Unit: USD
|
Item
|
December of 2019
|
Vs. November of 2019 (%)
|
2019 (USD)
|
Vs. 2018 (%)
|
Percentage (%)
|
|
Total
|
4,255,842,491
|
0.51
|
41,414,093,484
|
0.35
|
100
|
|
Computers, electronics and components
|
1,088,433,774
|
20.51
|
9,557,546,067
|
14.27
|
23.08
|
|
Phones and accessories
|
935,519,596
|
-19.41
|
8,293,172,693
|
-11.54
|
20.03
|
|
Fruit and vegetables
|
187,739,158
|
14.82
|
2,429,651,672
|
-12.72
|
5.87
|
|
Fibers of all kinds
|
212,398,450
|
4.36
|
2,400,738,283
|
8.33
|
5.8
|
|
Footwear of all kinds
|
147,023,355
|
-24.01
|
1,780,945,065
|
19.36
|
4.3
|
|
Textiles and garments
|
138,717,037
|
2.27
|
1,594,179,704
|
3.47
|
3.85
|
|
Machines, equipment and spare parts
|
170,984,976
|
10.01
|
1,584,339,775
|
7.58
|
3.83
|
|
Rubber
|
204,027,633
|
4.31
|
1,551,436,953
|
13.11
|
3.75
|
|
Cameras, camcorders and components
|
46,151,253
|
-39.04
|
1,533,925,720
|
-45.24
|
3.7
|
|
Seafood
|
128,509,820
|
-1.15
|
1,230,561,031
|
23.56
|
2.97
|
|
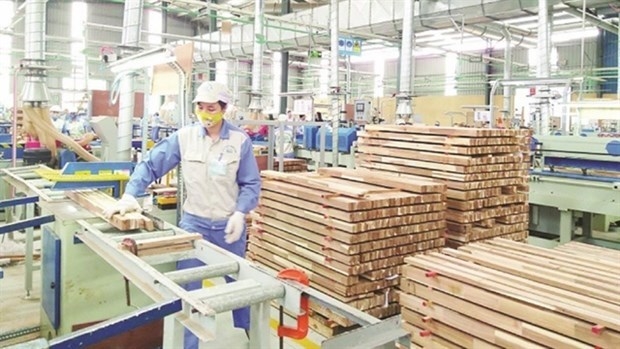
Wood and furniture
|
120,518,682
|
45.2
|
1,162,732,880
|
8.43
|
2.81
|
|
Cassava and products
|
102,289,092
|
-1.91
|
864,031,400
|
2.33
|
2.09
|
|
Cement and clinker
|
97,774,694
|
14.51
|
629,891,196
|
70.65
|
1.52
|
|
Electric wires and cables
|
67,944,648
|
-8.47
|
621,269,702
|
1.12
|
1.5
|
|
Cashew nuts
|
71,413,617
|
-2.45
|
590,423,380
|
30.6
|
1.43
|
|
Crude oil
|
20,250,484
|
-63.35
|
573,581,978
|
-3.51
|
1.38
|
|
Chemicals
|
34,414,167
|
0.67
|
490,180,919
|
-0.63
|
1.18
|
|
Plastics
|
38,974,214
|
9.25
|
433,417,169
|
-7.7
|
1.05
|
|
Petroleum of all kinds
|
33,084,049
|
25.6
|
384,392,229
|
15.92
|
0.93
|
|
Textile, garment, leather and footwear materials
|
23,037,244
|
-2.58
|
318,132,994
|
10.59
|
0.77
|
|
Means of transport and spare parts
|
24,083,455
|
-19.35
|
288,099,756
|
6.99
|
0.7
|
|
Rice
|
14,999,537
|
10.82
|
240,391,971
|
-64.82
|
0.58
|
|
Other ordinary metals and products
|
32,874,464
|
50.75
|
223,491,065
|
48
|
0.54
|
|
Chemical products
|
18,003,241
|
-20.47
|
222,074,799
|
56.19
|
0.54
|
|
Paper and products
|
34,048,297
|
53.27
|
213,267,001
|
-11.23
|
0.51
|
|
Iron and steel of all kinds
|
55,583,609
|
9.99
|
192,634,506
|
1.849.05
|
0.47
|
|
Animal feed and materials
|
12,432,595
|
-1.34
|
182,596,496
|
-15.01
|
0.44
|
|
Handbags, wallets, suitcases, hats and umbrellas
|
18,283,383
|
88.78
|
159,319,786
|
-2.91
|
0.38
|
|
Plastic products
|
11,680,359
|
-5.92
|
148,732,212
|
37.06
|
0.36
|
|
Coffee
|
11,648,619
|
8.33
|
101,137,305
|
-7.67
|
0.24
|
|
Iron and steel products
|
5,945,700
|
3.8
|
89,150,869
|
49.18
|
0.22
|
|
Rubber products
|
7,568,888
|
13.18
|
82,138,342
|
-8.48
|
0.2
|
|
Ores and other materials
|
5,108,438
|
92.32
|
76,671,479
|
0.28
|
0.19
|
|
Confectionery and grain products
|
5,990,636
|
-4.1
|
74,311,376
|
-4.33
|
0.18
|
|
Toys, sports equipment and spare parts
|
4,702,063
|
-4.52
|
51,452,269
|
28.05
|
0.12
|
|
Tea
|
1,130,183
|
59.67
|
23,801,236
|
21.02
|
0.06
|
|
Ceramic and porcelain products
|
2,403,968
|
-10.12
|
22,251,867
|
30.52
|
0.05
|
|
Glass and products
|
1,976,843
|
32.58
|
20,526,391
|
-45.76
|
0.05
|
|
Non- wooden furniture
|
1,664,202
|
-26.12
|
20,484,141
|
43.46
|
0.05
|
|
Bamboo, rattan,sedge and carpet products
|
860,881
|
0.12
|
11,137,418
|
-7.09
|
0.03
|
|
Other technical materials
|
1,076,511
|
29.92
|
10,676,825
|
-9.42
|
0.03
|
|
Others
|
114,570,674
|
41.4
|
935,195,563
|
|
2.26
|
CK
Source: VITIC
HCM City sees over 22% rise in FDI inflows in Q1
Seafood market Update: The Seafood Expo North America
DAILY: Vietnamese coffee prices increased by 1000 VND on March 31
DAILY: Vietnamese pepper prices remained unchanged on March 31
Q1 trade of agro-forestry-fisheries products exceeds 20 billion USD
Reference exchange rate down 3 VND on March 31
Imports of materials for animal feed production in February and first two months
Vietnam expected to export 7 million tonnes of rice this year: Ministry
Goods retail sales, service revenue rise almost 14% in Q1
Vietnamese banks remain attractive to foreign investors
Rice market Update: 2023 set to be favourable for Vietnamese rice enterprises
DAILY: Vietnamese pepper prices fell by 500 VND on March 30
DAILY: Vietnamese coffee prices fell by 300 VND on March 30
Vietnam runs trade surplus of 4.07 bln USD in Q1

Plan on implementing Decision No. 327/QD-TTG dated March ...
Concretize viewpoints, objectives, tasks and solutions of the plan in accordance with practical conditions of the locality, associating ...Plan on implementing national environmental protection ...
Implementation plan of marine aquaculture development ...
Program on conservation and development of Vietnamese ...
Plan on improving quality of human resources to 2025 and ...

Efforts taken to turn culinary culture into national ...
The Vietnam Cuisine Culture Association (VCCA) is taking steps to implement a project to build and develop Vietnamese culinary culture ...Vietnamese cuisine making a name for itself with ...
Vietnam advance to next round of AFC U20 Women’s Asian Cup
Cultural tourism and traditional values promoted through ...
