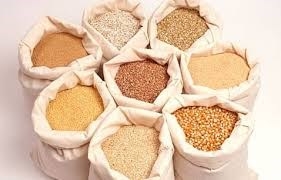
Exports of animal feed and materials increased in April
Friday, June 14,2019
AsemconnectVietnam - In April of 2019, Vietnam’s exports of animal feed and raw materials increased by 10.4 per cent compared to the previous month to over 202 million USD, contributing 0.25 per cent into the total export turnover of the country.
In 2017, the export turnover of animal feed and materials only increased by 4 per cent year – on - year, but in 2018 it increased by 14.2 per cent. In January of 2019, the exports of animal feed and materials increased by 10.1 per cent compared to December 2018, but decreased by 4.5 per cent compared to January of 2018. In February of 2019, the exports of animal feed and materials decreased by 30.5 per cent over the previous month, but in April of 2019, the exports of animal feed and materials increased by 10.4 per cent compared to March of 2019 with 62.2 million USD.
The total exports of animal feed and materials in the first 4 months of 2019 reached 202.77 million USD, accounting for 0.25 per cent of the total, but decreased by 7.9 per cent compared to the same period last year.
Vietnam’s exports of animal feed and materials in 2016 -2019 period – source: the General Department of Customs
|
|
Turnover (USD)
|
(%) of the total
|
+/- vs. same period last year (%)
|
|
2016
|
586,477,801
|
0.332
|
15.7
|
|
2017
|
609,749,388
|
0.284
|
4.0
|
|
2018
|
695,790,141
|
0.285
|
14.2
|
|
First 4 months of 2019
|
202,778,919
|
0.255
|
-7.9
|
Vietnam exported animal feed and raw materials mostly to Southeast Asia - the main market, accounting for 35.65 per cent of the proportion.
Accordingly, China was leading with the turnover of 55.18 million USD, but down by 10.37 per cent over the same period last year. In April 2019 alone, Vietnam exported to this market 22.5 million USD worth of animal feed and materials, an increase of 35.83 per cent compared to March of 2019 but decreased by 11.81 per cent compared to April of 2018.
The second was Cambodia market, with the export turnover of 31.25 million USD, increasing by 8.22 per cent compared to the first 4 months of 2018. In April of 2019 alone, it was exported to 7.54 million USD, down by 11.21 per cent compared to March of 2019 but increased by 10.03 per cent compared to April of 2018.
In the group of 10 key markets, the exports to India fell the most by 35.79 per cent, equivalent to 19.4 million USD. In April of this year, the exports of animal feed and materials to India decreased by 2.73 per cent over the previous month and by 33.93 per cent compared to April of 2018. The next was the US market – decreased by 29.84 per cent and Thailand - down by 28.62 per cent.
Vietnam’s exports of animal feed and materials in April and the first four months of 2019– source: the General Department of Customs
|
Market
|
April of 2019 (USD)
|
+/- April of 2019 vs. March of 2019 (%)
|
First 4 months of 2019 (USD)
|
+/- First 4 months of 2019 vs. (%)
|
|
China
|
22,549,004
|
35.83
|
55,187,461
|
-10.37
|
|
Cambodia
|
7,540,703
|
-11.21
|
31,252,711
|
8.22
|
|
Malaysia
|
5,461,860
|
10.87
|
21,214,416
|
8.22
|
|
India
|
6,573,011
|
-2.73
|
19,403,823
|
-35.79
|
|
Japan
|
2,211,231
|
-14.66
|
14,027,305
|
43
|
|
The U.S
|
2,884,636
|
-7.73
|
9,952,753
|
-29.84
|
|
Thailand
|
2,187,771
|
-18.89
|
9,022,813
|
-28.62
|
|
Taiwan
|
1,931,573
|
-8.22
|
7,283,638
|
-20.39
|
|
South Korea
|
2,603,371
|
104.09
|
6,240,073
|
12.79
|
|
The Philippines
|
1,876,021
|
59.05
|
6,138,954
|
32.5
|
|
Bangladesh
|
1,179,090
|
-15.48
|
4,393,296
|
8.06
|
|
Indonesia
|
1,518,417
|
100.24
|
3,759,509
|
6.01
|
|
Singapore
|
217,723
|
-15.53
|
918,051
|
-18.45
|
Fertilizer export markets in first 5 months of 2023
Exports of animal feed reached 426.3 million USD in first 5 months of 2023
Imports of animal feed reached over 1.93 billion USD in first 5 months of 2023
DAILY: Vietnamese pepper prices fell by 500 VND on June 23
DAILY: Vietnamese coffee prices rose by 200 VND on June 23
Exports to China reached 20.3 billion USD in first 5 months of 2023
Coffee exports surpassed 2 billion USD in first 5 months of 2023
Vietnam considered rising star to become emerging market
Vietnam logistics sector offers attractive investment opportunities
Hanoi’s economy sees effective recovery
Reference exchange rate on upward trend
Vietnam lychee market update: Harvest in Central Highlands a success
DAILY: Vietnamese pepper prices fell by 500 VND on June 22
DAILY: Vietnamese coffee prices fell by 500 VND on June 22

Plan on implementing national strategy on climate change ...
Actively and effectively adapting, reducing vulnerability, loss and damage due to climate change; reduce greenhouse gas emissions ...Scheme on attracting, restructuring and improving quality ...
Urban development plan of Binh Phuoc province in a period ...
Plan on implementing Decision No. 327/QD-TTG dated March ...

Hung Kings Temple Festival 2023 kicks off
The Hung Kings Temple Festival 2023 and the Culture and Tourism Week of Ancestral Land 2023 kicked off in the northern province of Phu Tho ...Vietnam trounce Palestine at AFC U-17 Women's Asian ...
Phu Tho: Festival honours UNESCO intangible cultural ...
Saigontourist Group Food and Culture Festival 2023 opens
Vietnam’s top swimmer Huy Hoang to hold Vietnamese flag at ...


