AsemconnectVietnam - Vietnam’s GDP in the third quarter of 2018 was estimated to increase by 6.88% over the same period last year, although lower than the increase of 7.45% in the first quarter but higher than the increase of 6.73% in the second quarter[1], showing that the economy still retains its growth momentum according to the General Statistics Office (GSO).
The sector of agriculture, forestry and fishery grew by 3.46%. The sector of industry and construction grew by 8.61%. The service sector expanded by 6.87%. The growth in the third quarter of 2018 was lower than the growth in the third quarter of 2017, but higher than the growth in the third quarter of years 2011-2016
[2].
In terms of GDP use in the third quarter of 2018, final consumption increased by 7.02% from the same period last year; accumulated assets grew by 8.61%; export of goods and services jumped up by 15.13%; import of goods and services climbed by 14.76%.
Generally, in nine months of 2018, GDP was estimated to increase by 6.98% compared with the same period last year, this is the highest growth of nine months since 2011
[3]. Of the growth of the whole economy, the sector of agriculture, forestry and fishery increased by 3.65%, contributed 8.8% to the general growth; the sector of industry and construction went up by 8.89%, contributed 48.7%; the service sector grew by 6.89%, contributed 42.5%.
In nine months of this year, the sector of agriculture, forestry and fishery gained the highest growth in the period 2012-2018. In particular, the agriculture continued to confirm the clear trend of recovery with the increase of 2.78%, the highest increase of nine months in the period 2012-2018, contributed 0.36 percentage point to the growth rate of the total added value of the whole economy; the fishery achieved a good result with an increase of 6.37%, also the highest growth rate in the past eight years
[4], contributing 0.22 percentage point; the forestry jumped up by 5.9%, but low propotion, contributed only 0.04 percentage point.
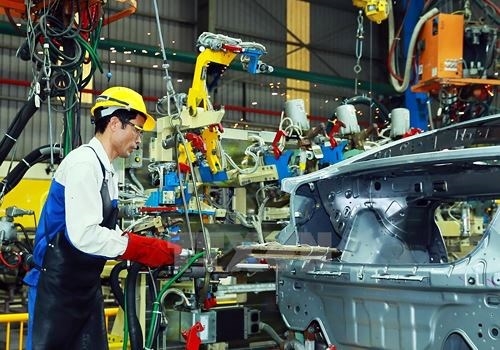
In the sector of industry and construction, the industry maintained the fairly good growth with an 8.98% rise in nine months, contributed 2.91 percentage points to the growth rate of the total added value of the whole economy. The manufacturing continued to be a highlight of this sector and main driver of economic growth with a high increase of 12.65%, lower than the increase of the same period in 2017, but much higher than the growth of nine months of years 2012-2016
[5], contributed 2.56 percentage points. The mining and quarrying still received a negative growth (down 1.97%), reduced 0.14 percentage point of the growth rate of the total added value of the whole economy, however, the reduction rate narrowed considerably compared with the decrease of 8.08% in the same period last year. The construction in nine months maintained a relatively high growth rate of 8.46%, contributing 0.55 percentage point.
The service sector increased by 6.89% in nine months of this year, lower than the 7.21% increase of nine months last year, but higher than the growth of the same period in years 2012-2016
[6]. In the service sector, the contribution of a number of industries with a large share to the overall growth rate in nine months was as follows: Wholesale and retail sales increased by 8.48% over the same period last year, this was the industry with the highest growth rate in the service sector with the largest contribution to the growth rate of the total added value of the entire economy (0.9 percentage point); Financial, banking and insurance activities raised by 7.85%, contributed 0.46 percentage point; Accommodation and catering service grew by 5.89%, contributed 0.27 percentage point; Transportation and storage climbed by 7.55%, contributed 0.25 percentage point; Real estate business moved up by 4.04%, contributed 0.24 percentage point.
About economic structure in nine months of 2018, the sector of agriculture, forestry and fishery made up 13.93% of GDP; the sector of industry and construction accounted for 33.49%; the service sector represented 42.54%; the taxes less subsidies on production took 10.04% (the corresponding structure in the same period in 2017 was 14.67%; 32.50%; 42.65%; and 10.18%).
In terms of GDP use in nine months of 2018, final consumption put up by 7.09% from the similar period in 2017; accumulated assets grew by 7.71%; export of goods and services increased by 15.52%; import of goods and services went up by 14.22%.
[1] GDP growth in the second quarter of 2018 was down 0.06 percentage point from the 6.79% estimate due to the adjustment of the growth of the agricultural, forestry and fishery sector and the service sector to reduce 0.25 percentage point (the main reason was that the estimated data of cashew, pepper, whiteleg shrimp was higher than the preliminary data) and 0.01 percentage point, respectively.
[2] GDP growth in the third quarter of some years was as follows: an increase of 6.21% in 2011; an increase of 5.39% in 2012; a 5.54% increase in 2013; a growth of 6.07% in 2014; a rise of 6.87% in 2015; a rise of 6.56% in 2016; an increase of 7.38% in 2017; and a 6.88% increase in 2018.
[3] GDP growth in nine months of some years was as follows: a rise of 6.03% in 2011; a rise of 5.10% in 2012; a rise of 5.14% in 2013; a rise of 5.53% in 2014; a 6.53% growth in 2015; an increase of 5.99% in 2016; an increase of 6.41% in 2017; and a 6.98% increase in 2018.
[4] The growth rate of the total added value of the fishery sector in nine months of some years was as follows: a growth of 3.46% in 2011; a 4.06% growth in 2012; a rise of 2.95% in 2013; a 6.15% rise in 2014; an increase of 2.11% in 2015; a 1.81% increase in 2016; a growth of 5.48% in 2017; and a 6.37% growth in 2018.
[5] The growth rate of the added value of the manufacturing in nine months increased by 8.74% in 2012; 6.58% in 2013; 7.09% in 2014; 10.15% in 2015; 11.10% in 2016; 12.77% in 2017; and 12.65% in 2018.
[6] The growth rate of the added value of the service sector in nine months of some years was as follows: a rise of 6.47% in 2012; a rise of 6.43% in 2013; a 5.94% rise in 2014; an increase of 6.10% in 2015; a 6.67% increase in 2016; a growth of 7.21% in 2017; and a 6.89% growth in 2018.
Source: General Statistics office


