


Imports of goods from China reached over US$41.63 billion in eight months
Thursday, October 11,2018
AsemconnectVietnam - The bilateral trade exchange between Vietnam and China totaled US$66.03 billion in the first eight months of this year, increased by 19.5 per cent over the same period last year, showed the statistics figures of the General Department of Customs.
Machines, equipment and spare parts were leading the list of items imported by the country from China in the first eight months of this year with the import value of $7.6 billion, up by over 5 per cent year – on – year and accounted for 18.3 per cent of the total. It was followed by telephones and components - $5.23 billion, up by 13 per cent; computers, electronics and components - $4.73 billion, up by 7.8 per cent; fabrics - $4.63 billion, up by 18.5 per cent; iron and steel - $3.13 billion, up by 8 per cent; textile, garment, leather and footwear materials - $1.43 billion, up by 5.8 per cent; plastic products - $1.34 billion, up by 15.8 per cent; chemicals - $1.04 billion, up by 28 per cent.
In the first eight months of this year, Vietnam’s imports of cameras, camcorders and components increased sharply by 157.6 per cent to $553.26 million; petroleum – up by 98 per cent to $683.28 million; ordinary metal products – up by 85.6 per cent to $426.84 million; oil and grease – up by 64.6 per cent to $11.24 million; animal feed and materials – up by 57.3 per cent to $158.55 million; fruits and vegetables – up by 56.6 per cent to $250.62 million; coal – up by 53.9 per cent to $197.71 million.
However, the imports of CBU autos from China fell sharply by 91.5 per cent year – on – year to $16.3 million; and the imports of pharmaceuticals; fertilizer; rubber and tobacco materials also increased sharply by 35.2 per cent; 30.4 per cent; 24.9 per cent and 20.3 per cent, respectively year – on – year.
Imports of goods from China in the first 8 months of 2018 - Unit: US$ - source: VITIC – according to the figures of the General Department of Customs
|
Item
|
August of 2018
|
August of 2018 vs. July of 2018
(%)
|
First 8 months of 2018
|
First 8 months of 2018 vs. same period of 2017 (%)
|
|
Total
|
5,778,845,750
|
4.01
|
41,633,793,263
|
14.05
|
|
Machines, equipment and spare parts
|
1,051,203,035
|
3.66
|
7,600,248,738
|
5.03
|
|
Telephones and components
|
893,359,244
|
27.42
|
5,226,696,660
|
13.05
|
|
Computers, electronics and components
|
759,797,716
|
15.95
|
4,725,626,319
|
7.78
|
|
Fabrics of all kinds
|
567,181,104
|
-8.49
|
4,633,864,397
|
18.47
|
|
Iron and steel of all kinds
|
353,402,726
|
-22.66
|
3,127,165,454
|
7.98
|
|
Textile, garment, leather and footwear materials
|
185,433,633
|
5.49
|
1,430,888,457
|
5.81
|
|
Plastic products
|
179,112,596
|
7.49
|
1,339,356,873
|
15.75
|
|
Chemicals
|
133,285,857
|
-0.75
|
1,040,110,945
|
27.96
|
|
Iron and steel products
|
148,184,314
|
16.91
|
977,075,834
|
33.57
|
|
Chemical products
|
113,225,847
|
-1.82
|
893,100,344
|
19.03
|
|
Other ordinary metal products
|
116,733,927
|
-8.14
|
840,088,766
|
49.51
|
|
Fibers of all kinds
|
111,403,843
|
10.09
|
807,435,163
|
44.36
|
|
Plastics
|
96,571,286
|
7.24
|
719,410,460
|
20.92
|
|
Petroleum of all kinds
|
75,448,238
|
2.08
|
683,275,149
|
98.1
|
|
Cameras, camcorders and components
|
76,242,228
|
-11.69
|
553,257,959
|
157.63
|
|
Other metal products
|
55,499,355
|
3.52
|
426,839,585
|
85.57
|
|
Auto components and spare parts
|
51,933,527
|
-17.7
|
408,814,116
|
-3.97
|
|
Electric wires and cables
|
53,209,065
|
11.02
|
402,831,620
|
-2.05
|
|
Glass and products
|
43,956,518
|
9.73
|
325,247,557
|
5.42
|
|
Household appliances and components
|
30,106,075
|
-8.07
|
320,582,947
|
23.6
|
|
Pesticide and materials
|
27,811,531
|
-32.46
|
298,026,447
|
-16.8
|
|
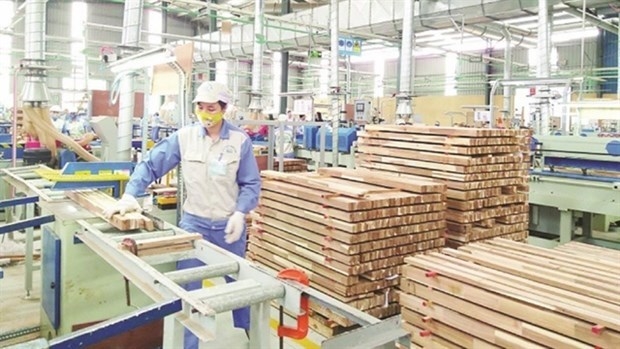
Wood and furniture
|
40,472,089
|
6.9
|
265,622,140
|
10.95
|
|
Fruits and vegetables
|
51,310,049
|
-7.87
|
250,615,155
|
56.57
|
|
Fertilizer of all kinds
|
39,518,880
|
20.3
|
245,609,577
|
-30.37
|
|
Paper of all kinds
|
25,413,588
|
-5.94
|
218,091,104
|
2.34
|
|
Liquefied gas
|
27,684,170
|
42.12
|
212,017,719
|
13.42
|
|
Coal of all kinds
|
29,685,764
|
136.48
|
197,711,115
|
53.92
|
|
Paper products
|
25,391,917
|
9.44
|
188,611,185
|
4.12
|
|
Rubber products
|
23,391,374
|
0.68
|
172,620,678
|
13.4
|
|
Pharmaceutical materials
|
23,860,734
|
2.27
|
172,207,720
|
27.59
|
|
Animal feed and materials
|
24,534,572
|
9.73
|
158,553,959
|
57.31
|
|
Seafood
|
8,606,760
|
7.16
|
74,885,459
|
-4.29
|
|
Other means of transport and spare parts
|
6,633,683
|
-52.11
|
60,762,391
|
3.79
|
|
Other oil products
|
7,265,457
|
-18.28
|
58,008,827
|
52.55
|
|
Tobacco materials
|
6,484,515
|
125.36
|
56,817,210
|
-20.28
|
|
Ores and minerals
|
8,261,951
|
44.33
|
50,798,746
|
41.55
|
|
Rubber
|
5,625,677
|
18.54
|
47,838,471
|
-24.92
|
|
Fragrant and hygiene products
|
4,805,833
|
4.12
|
39,320,450
|
17.88
|
|
Other food products
|
3,487,791
|
-4.83
|
28,251,141
|
7.89
|
|
Pharmaceuticals
|
3,432,203
|
11.45
|
25,241,004
|
-35.19
|
|
Precious stones, metals and products
|
3,960,656
|
78.6
|
20,180,682
|
37.01
|
|
CBU autos of all kinds
|
2,594,600
|
-35.27
|
16,299,965
|
-91.49
|
|
Confectionery and grain products
|
1,861,810
|
-13.81
|
11,717,330
|
47.38
|
|
Oil and grease
|
738,769
|
41.52
|
11,236,034
|
64.55
|
|
Cotton of all kinds
|
344,048
|
228.92
|
1,169,546
|
-16.66
|
Vietnam's coffee exports slow in Q1 as domestic prices rise
Vietnamese businesses updated on India’s new foreign trade policy
Reference exchange rate up 2 VND on April 7
Bac Giang hastens public investment projects, industrial parks
Bac Giang province boosts farm produce sales
Resolution on oil, gas sector to fuel Ba Ria - Vung Tau’s growth
Vietnam eyes 30 billion USD in food, food stuff exports annually
Vietnam exports 1.7 million tonnes of rice in Q1
DAILY: Vietnamese pepper prices remained unchanged on April 7
DAILY: Vietnamese coffee prices decreased by 300 VND on April 7
Industrial production index fell in Q1
Labour market continues recovering in Q1
Rice market update: Vietnam's ST25 rice exported to the Republic of Vanuatu
DAILY: Vietnamese pepper prices remained unchanged on April 6

Plan on implementing Decision No. 327/QD-TTG dated March ...
Concretize viewpoints, objectives, tasks and solutions of the plan in accordance with practical conditions of the locality, associating ...Plan on implementing national environmental protection ...
Implementation plan of marine aquaculture development ...
Program on conservation and development of Vietnamese ...
Plan on improving quality of human resources to 2025 and ...

Efforts taken to turn culinary culture into national ...
The Vietnam Cuisine Culture Association (VCCA) is taking steps to implement a project to build and develop Vietnamese culinary culture ...Vietnamese cuisine making a name for itself with ...
Vietnam advance to next round of AFC U20 Women’s Asian Cup
Cultural tourism and traditional values promoted through ...
