


Exports to U.S increased 25.7 per cent in two months
Wednesday, April 8,2020
AsemconnectVietnam - According to the preliminary statistics figures of the General Department of Customs, Vietnam’s total imports of goods from the US reached 2.18 million USD and the country’s exports of goods to this market reached 10.26 billion USD in the first two months of this year.
Mobile phones and accessories group ranked second with 18.16 per cent of the total market share, gaining 1.86 billion USD, up by 33.38 per cent. This group in February 202020 alone has increased to 238.77 per cent in value compared to the previous month. Computer, electronic products and components saw strong growth of 134.57 per cent to 1.2 billion USD, accounting for 11.72 per cent of the total market share.
Among 9 commodity groups with a turnover of hundreds of millions of USD, the group of toys, sports equipment and parts got the highest export turnover, increased by 148.29 per cent to 180.4 million USD; Other machines, equipment, tools and spare parts increased by 53.31 per cent to 952.37 million USD; Plastic products increased by 41.99 per cent to 112.67 million USD.
Vietnam’s exports of goods to the U.S in the first 2 months of 2020 – according to the figures of the General Department of Customs – Unit: USD
|
Item
|
February of 2020
|
Vs. January of 2020 (%)
|
First 2 months of 2020
|
Vs. first 2 months of 2019 (%)
|
Market share (%)
|
|
Toal
|
5,508,040,891
|
15.58
|
10,261,880,266
|
25.7
|
100
|
|
Textiles and garments
|
1,034,968,397
|
-15.09
|
2,249,437,137
|
5.25
|
21.92
|
|
Phones and accessories
|
1,440,085,767
|
238.77
|
1,863,139,184
|
33.38
|
18.16
|
|
Computers, electronics and components
|
612,230,162
|
3.65
|
1,202,386,232
|
134.57
|
11.72
|
|
Footwear of all kinds
|
479,734,948
|
-5.45
|
985,190,979
|
7.38
|
9.6
|
|
Machines, equipment, tools and spare parts
|
453,141,821
|
-9.32
|
952,371,123
|
53.31
|
9.28
|
|
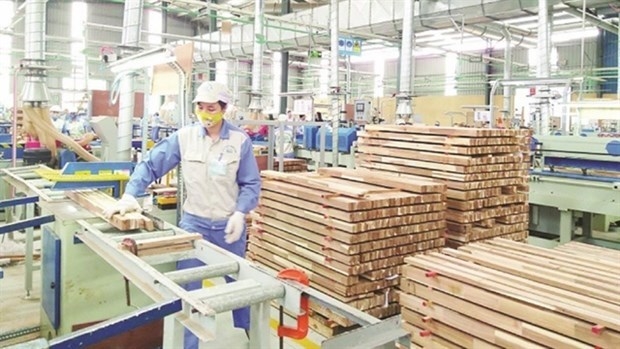
Wood and furniture
|
377,032,548
|
-12.63
|
807,951,729
|
27.01
|
7.87
|
|
Means of transport and spare parts
|
131,863,118
|
5.44
|
256,891,850
|
12.51
|
2.5
|
|
Handbags, wallets, suitcases, hats and umbrellas
|
101,394,046
|
-15.15
|
220,756,389
|
-4.23
|
2.15
|
|
Toys, sport equipment and spare parts
|
94,653,653
|
9.89
|
180,405,765
|
148.29
|
1.76
|
|
Seafood
|
93,103,058
|
7.41
|
179,511,676
|
0.8
|
1.75
|
|
Cashew nuts
|
72,668,827
|
35.68
|
126,225,879
|
3.56
|
1.23
|
|
Plastic products
|
55,854,313
|
-1.8
|
112,672,307
|
41.99
|
1.1
|
|
Iron and steel products
|
42,482,161
|
1.49
|
84,301,915
|
-7.55
|
0.82
|
|
Other metals and products
|
41,975,750
|
38.59
|
72,214,757
|
23.61
|
0.7
|
|
Electric wires and cables
|
27,256,533
|
-13.93
|
58,965,922
|
104.09
|
0.57
|
|
Precious stones, metals and products
|
32,370,077
|
32.4
|
56,818,465
|
1.48
|
0.55
|
|
Coffee
|
23,324,984
|
-5.78
|
48,079,900
|
-9.47
|
0.47
|
|
Paper and products
|
14,921,132
|
-8.6
|
31,176,677
|
70.21
|
0.3
|
|
Rubber products
|
16,630,408
|
17.45
|
30,790,388
|
18.74
|
0.3
|
|
Bamboo, rattan, sedge and carpet products
|
15,324,919
|
2.05
|
30,341,614
|
66.68
|
0.3
|
|
Ceramic and porcelain products
|
11,390,712
|
-17.23
|
25,150,163
|
23.68
|
0.25
|
|
Technical fabrics
|
11,932,158
|
-5.25
|
24,525,304
|
-35.12
|
0.24
|
|
Iron and steel of all kinds
|
15,613,089
|
79.98
|
24,287,829
|
-71.28
|
0.24
|
|
Fruit and vegetables
|
11,648,100
|
6.54
|
22,586,132
|
16.32
|
0.22
|
|
Pepper
|
12,055,762
|
45.56
|
20,333,296
|
-12.38
|
0.2
|
|
Cameras, camcorders and components
|
5,296,962
|
-43.64
|
14,695,764
|
33.34
|
0.14
|
|
Textile, garment, leather and footwear materials
|
6,648,370
|
-8.95
|
13,950,189
|
64.21
|
0.14
|
|
Glass and products
|
5,291,149
|
-20.77
|
11,968,321
|
41.84
|
0.12
|
|
Animal feed and materials
|
5,762,110
|
14.56
|
10,765,803
|
173.12
|
0.1
|
|
Fibers of all kinds
|
6,729,224
|
73.86
|
10,599,669
|
17.49
|
0.1
|
|
Confectionery and grain products
|
5,161,803
|
9.66
|
9,869,080
|
18.24
|
0.1
|
|
Rubber
|
3,874,159
|
38.54
|
6,670,485
|
-5.71
|
0.07
|
|
Chemical products
|
2,650,931
|
12.69
|
5,003,288
|
20.54
|
0.05
|
|
Chemicals
|
2,170,189
|
23.98
|
3,920,655
|
3.7
|
0.04
|
|
Rice
|
856,429
|
19.86
|
1,570,961
|
49.49
|
0.02
|
|
Tea
|
845,065
|
116.63
|
1,235,164
|
14.49
|
0.01
|
|
Others
|
239,098,056
|
-10.34
|
505,118,274
|
17.57
|
4.92
|
Raw cashew nut imports from Cambodia skyrocketed
Vietnam’s trade with top 11 Asian markets is set to grow significantly
Trade recovers strongly since reopening
Reference exchange rate down 2 VND on March 17
DAILY: Vietnamese pepper prices rose by 500 VND on March 17
DAILY: Vietnamese coffee prices increased by 500 VND on March 17
Vietnam posts 78.9% growth in coffee export value to Spain
9 export items with positive growth in first 2 months of 2023
Seafood exports in February and first 2 months of 2023
Vietnam’s regulatory interest rates to be reduced by 0.5-1 percent
Consumer rights protection online a focus amid e-commerce boom
Opportunities for Vietnamese goods in foreign supermarkets
Reference exchange rate up 3 VND
Rice exports reached more than 893,000 tonnes in 2 months

Plan on implementing Decision No. 327/QD-TTG dated March ...
Concretize viewpoints, objectives, tasks and solutions of the plan in accordance with practical conditions of the locality, associating ...Plan on implementing national environmental protection ...
Implementation plan of marine aquaculture development ...
Program on conservation and development of Vietnamese ...
Plan on improving quality of human resources to 2025 and ...

Efforts taken to turn culinary culture into national ...
The Vietnam Cuisine Culture Association (VCCA) is taking steps to implement a project to build and develop Vietnamese culinary culture ...Vietnamese cuisine making a name for itself with ...
Vietnam advance to next round of AFC U20 Women’s Asian Cup
Cultural tourism and traditional values promoted through ...
