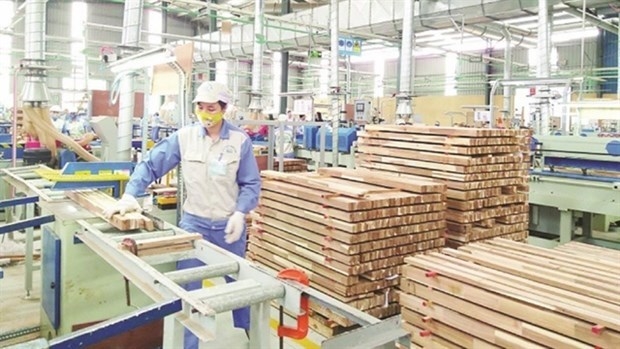
Bamboo and rattan products export up by 23.3% in 9 months
Thursday, November 12,2020
AsemconnectVietnam - Vietnam raked in nearly 420.14 million U.S. dollars from exporting bamboo and rattan products between January and September this year, witnessing a year-on-year increase of 23.3 percent, according to preliminary statistics of the General Department of Customs on October 14.
|
Market
|
September 2020
|
+/- VS. Same period in August 2020 (%)
|
The first 9 months of 2020
|
+-vs. Same period in 2019 (%)
|
Market share (%)
|
|
Total
|
54,709,115
|
-2.66
|
420,139,346
|
23.32
|
100
|
|
The US
|
20,747,013
|
-6.53
|
155,225,285
|
60.75
|
36.95
|
|
EU
|
13,426,937
|
-9.81
|
120,250,235
|
12.32
|
28.62
|
|
Japan
|
6,310,578
|
4.26
|
43,246,298
|
-14.89
|
10.29
|
|
Germany
|
2,597,012
|
-12.78
|
24,583,438
|
18.46
|
5.85
|
|
England
|
1,439,847
|
-26.2
|
19,479,708
|
-0.43
|
4.64
|
|
Australia
|
3,392,938
|
11.03
|
17,662,232
|
26.63
|
4.2
|
|
South Korea
|
1,787,296
|
-3.91
|
15,460,395
|
15.65
|
3.68
|
|
France
|
1,980,738
|
71.21
|
14,778,786
|
-8,31
|
3.52
|
|
Netherlands
|
1,979,138
|
23.01
|
13,407,974
|
27.69
|
3.19
|
|
Spain
|
1,237,932
|
-28.77
|
13,107,643
|
-12.8
|
3.12
|
|
Belgium
|
1,030,534
|
-59.2
|
11,986,002
|
118.91
|
2.85
|
|
India
|
1,617,066
|
36.34
|
9,020,102
|
-2.12
|
2.15
|
|
China
|
867,969
|
-36.76
|
8,063,525
|
-3.96
|
1.92
|
|
Canada
|
764,964
|
34.22
|
7,372,603
|
8.07
|
1.75
|
|
Sweden
|
969,922
|
49.36
|
7,248,977
|
37.94
|
1.73
|
|
Italia
|
742,796
|
-34,25
|
6,360,955
|
2.38
|
1.51
|
|
Poland
|
798,580
|
33.05
|
4,853,267
|
41.17
|
1.16
|
|
Denmark
|
650,438
|
18.27
|
4,408,324
|
16.44
|
1.05
|
|
Taiwan (China)
|
504,846
|
31.36
|
3,543,256
|
-24.78
|
0.84
|
|
Russia
|
271,260
|
-40.99
|
2,930,016
|
29.35
|
0.7
|
|
Brazil
|
164,017
|
144.55
|
751,110
|
-6.93
|
0.18
|
|
Austria
|
#
|
#
|
35,161
|
-96.22
|
0.01
|
Source: VITIC/Vinanet.vn
Raw cashew nut imports from Cambodia skyrocketed
Vietnam’s trade with top 11 Asian markets is set to grow significantly
Trade recovers strongly since reopening
Reference exchange rate down 2 VND on March 17
DAILY: Vietnamese pepper prices rose by 500 VND on March 17
DAILY: Vietnamese coffee prices increased by 500 VND on March 17
Vietnam posts 78.9% growth in coffee export value to Spain
9 export items with positive growth in first 2 months of 2023
Seafood exports in February and first 2 months of 2023
Vietnam’s regulatory interest rates to be reduced by 0.5-1 percent
Consumer rights protection online a focus amid e-commerce boom
Opportunities for Vietnamese goods in foreign supermarkets
Reference exchange rate up 3 VND
Rice exports reached more than 893,000 tonnes in 2 months

Plan on implementing Decision No. 327/QD-TTG dated March ...
Concretize viewpoints, objectives, tasks and solutions of the plan in accordance with practical conditions of the locality, associating ...Plan on implementing national environmental protection ...
Implementation plan of marine aquaculture development ...
Program on conservation and development of Vietnamese ...
Plan on improving quality of human resources to 2025 and ...

Efforts taken to turn culinary culture into national ...
The Vietnam Cuisine Culture Association (VCCA) is taking steps to implement a project to build and develop Vietnamese culinary culture ...Vietnamese cuisine making a name for itself with ...
Vietnam advance to next round of AFC U20 Women’s Asian Cup
Cultural tourism and traditional values promoted through ...


